Showing posts with label LSR. Show all posts
  • Handicapping Fireworks

    POSTED Jul 4, 2014
    As I have been writing quite a bit about my database studies in recent days, I thought it might be a good time to use some of those studies to analyze a few upcoming races. So, without further ado, let’s look at some of the great races being run this weekend:

    (Click HERE for a sample Pace Profile Report that explains what all the figures mean.)

    JULY 4

    Arlington Park (race 3)


    (Click on image to enlarge)

    COMMENTS: 1-SLEEPY has the best overall speed, early speed rations (ESRs) and late speed rations (LSRs). Not surprisingly, he’s also the 8-5 morning line favorite. Still, the top choice appears to have a very slim margin of error and I would not take odds of less than 6-5 on him. I’m also more than a little intrigued by 4-PRINCE CHEVAL, who has finished in the money in four of his five trips over the Arlington Park main.

    Arlington Park (race 6)


    (Click on image to enlarge)

    COMMENTS: 1-FRABSTER is both versatile and consistent and could be on the engine in what — on paper, anyway — appears to be a paceless affair (-1 avg. ESR). He’s got a 1.05 Win Factor Rating (not shown) and looks fair at odds of 6-5 or greater.

    Parx Racing (race 6)


    (Click on image to enlarge)

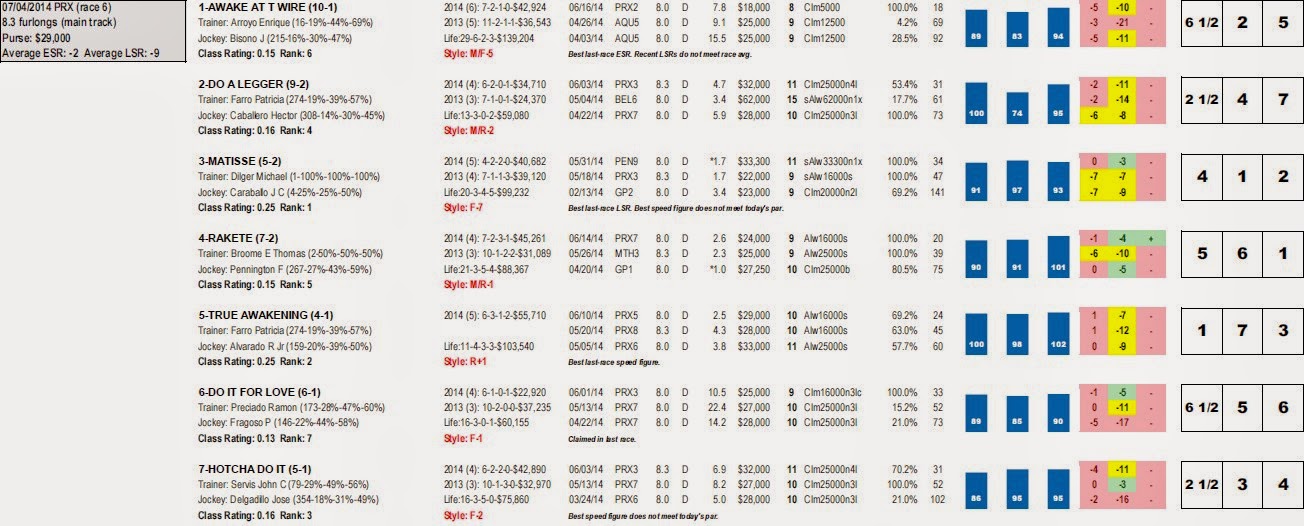
    COMMENTS: Although the speed and pace figures favor 3-MATISSE and 4-RAKETE, I like the price on 6-TRUE AWKENING, who has a 1.09 Win Factor Rating and 7-5 fair odds, yet is 4-1 on the morning line.

    JULY 5

    Belterra Park (race 7)

    (Click HERE for a sample Win Factor Report that explains what all the figures mean.)


    (Click on image to enlarge)

    COMMENTS: 2-EYE LOOK THE PART appears to be the swiftest of the bunch and a great overlay at 9-5 or better.

    JULY 6

    Woodbine (race 7)


    (Click on image to enlarge)

    COMMENTS: 6-WE MISS ARTIE has the best overall speed figures and LSRs — and he also boasts the top Class Rating — in Sunday’s 155th renewal of the Queen’s Plate for Canadian-bred three-year-olds. All that said, the son of Artie Schiller has yet to match the race (speed) par.
  • FREE Pace Profile Reports

    POSTED Jun 27, 2014
    To celebrate the re-launch of my Web site (SimonSpeedRations.com) and some of the great races taking place this weekend — the Grade I Gold Cup at Santa Anita and a trio of Grade III events at Prairie Meadows just to name a few — I decided to provide some free Pace Profile Reports for Saturday (see links below)

    In addition, to help readers make better use of those Reports, I’m going to highlight one of their more prominent features: the rankings section.


    (Click on image to enlarge)

    The rankings section is where each horse’s speed figures, early speed rations (ESRs) and late speed rations (LSRs) are compared to others in the field, providing a quick and convenient way to assess its merits.

    Of course, this but begs the question: What do the rankings really mean?

    Sure, one can surmise that lower rankings — a series of 1’s, for example — are probably better than higher rankings, but what exactly does “better” mean? Can one make money simply by betting on the lowest-ranked, i.e. best, horse in every race?

    Sorry, but no.

    My database studies reveal that the sole lowest-ranked horse in a field (ties were ignored) does, in fact, win far more often than random chance would suggest (1.91 impact value), but, alas, such stalwart steeds are bet accordingly and produce a negative 17.12 percent return on investment (ROI).

    Still, there is something to be said for the rankings, as they clearly do point out the strongest — and weakest — contenders, as the data below confirms:

    (Click on image to enlarge)
    Note: To be considered, a horse had to be ranked in all three categories — speed, ESRs and LSRs. What's more, at least half the field needed to be ranked in all of those categories as well.

    Notice that horses with a rankings sum of less than 15 win approximately 2/3 of the races. Of course some of this is due to the effect of field size — it’s obviously easier to achieve better (lower) rankings in a six-horse field than it is in a 12-horse field — but the impact values (IV) and odds-based impact values (OBIV) speak for themselves.

    To show how this type of quick and painless analysis can pay dividends, consider the opening daily double at Santa Anita on June 26, 2014:

    1st Race

    (Click on image to enlarge)

    2nd Race

    (Click on image to enlarge)

    In the first race, the sum of rankings is as follows:
    1. 9 ½
    2. 15
    3. 5
    4. 11
    5. 5 ½
    6. 17

    Clearly, the top two contenders appear to be 3-TWO IS TO MANY, with 5 points and a dominant speed edge (noted by his “1+” ranking in that category), and 5-DR WILLIAMS, with 5 ½ points. 1-COOK INLET (9 ½ points) ranks a distant third.

    The result couldn’t have been more perfect.


    (Click on image to enlarge)

    On to the second race, where the sum of rankings looks like this:

    1. 5
    2. 7
    3. 13
    4. 11
    5. 9
    6. N/A

    Here, we have a clearer choice in 1-YARD LINE who, like Two Is to Many in the preceding race, also has 5 points and a dominant speed edge. 2-SING WITH BLING is next with 7 points, but his relatively low LSR ranking of 4 makes me think he could get chewed up and spit out in a pace battle with Yard Line. 5-MISSING GROOM checks in third with 9 points and also boasts the best last-race LSR (-8) in the field, which should come in handy if the top two go at it early.

    Again, the results were right in line with the rankings:


    (Click on image to enlarge)

    Anyway, I hope this helps a little. Obviously, it's not always this easy, but at least the rankings provide a starting point to one's handicapping journey.


    FREE Pace Profile Reports (6/28/14)

  • A Historic Day?

    POSTED Jun 5, 2014
    On June 7, 2014, at Belmont Park in Elmont, NY, at approximately 6:52 PM Eastern Time, California Chrome will seek to become just the 12th Triple Crown winner in thoroughbred racing history.


    Since Affirmed became the 11th keeper of the Crown — I know, it sounds like a Tolkien novel — in 1978, 11 horses have captured the first two jewels of the series (the Derby and Preakness) only to fail in the third (the Belmont Stakes). I’ll Have Another would have been the 12th success or failure, but he was scratched the day before the Belmont and never raced again.

    Will California Chrome make history and “save racing” on Saturday?

    Time (hopefully under 2:30) will tell.

    You Call 36 Years a Drought?

    Lost in all the angst over the 36-year gap since Affirmed won the American Triple Crown, is the fact that there hasn’t been an English Triple Crown winner since Nijinsky in 1970 — 44 years ago.

    In fact, since Nijinsky’s sweep of the one-mile 2,000 Guineas, the 1 ½-mile Epsom Derby and the 1 ¾-mile (approximately) St. Leger Stakes, only three horses — Camelot (2012), Sea the Stars (2009) and Nashwan (1989) — have even had a shot at the coveted English Triple.

    What’s more, Nijinsky was the first English Triple Crown winner since the Aga Khan’s Bahram in 1935. So, by English standards, capturing the American Triple Crown is like earning a participation ribbon at a grade school field day. Since 1935, there have been nine American Triple Crown champs.

    Who said winning the Kentucky Derby, Preakness and Belmont was tough?


    The ‘Universal Bias’ Strikes Again

    In “Winning at the Races: Computer Discoveries in Thoroughbred Handicapping,” William L. Quirin, called early speed the “universal track bias” and, despite the 1 ½-mile distance and the vast expanse that is Belmont Park, statistics show that Quirin’s observation holds true for the Belmont Stakes as well.

    Since 2000, the average Belmont winner has been just 1.91 lengths back at the first (1/2-mile) call and 1.36 lengths in arrears at the second (10-furlong) call.

    Furthermore, Belmont winners have entered the Test of Champions with an average overall early speed ration (ESR) of -3. In fact, 9 of the past 14 Belmont champions have met that standard and they have produced an ROI of 258 percent to win, 60 percent to place and 10 percent to show.

    This year, just two horses qualify:

    * California Chrome (-4)
    * Samraat (-3)

    The Dope on Dosage

    With all the talk about California Chrome’s lack of distance breeding, I thought I would consult with an expert.

    Dr. Steven Roman runs the excellent Chef-de-Race Web site and is the creator of the Dosage Index (DI) so often referenced at this time of year.

    Although no horse with a DI greater than 3.00 has won the Belmont since Empire Maker (3.16) in 2003, Dr. Roman believes that horses like California Chrome, who has a 3.40 Dosage Index, have become the norm rather than the exception.

    “It is interesting to note that in this year's Derby and Preakness, California Chrome's DI falls essentially right on the respective trend lines,” Roman said. “In other words, in terms of Dosage, he is almost ideally representative of contemporary North American classic breeding.”

    “The patterns over time for all three Triple Crown events are similar, with the Dosage figures of the winners steadily increasing over time since 1940, reflecting the continuous shift toward speed in North American breeding,” Dr. Roman explained.

    “I doubt if there is a single horse these days bred specifically for the Belmont distance (at least on dirt). The result is that suitability to the distance is more an accident than intentional. Someday, a dozen sprinters may line up in the Belmont starting gate and one of them will have to win — not a pretty picture,” he concluded.


    Graphic courtesy of Dr. Steven Roman