Showing posts with label impact value. Show all posts
  • Eliminating the Non-Contenders in the Breeders’ Cup

    POSTED Oct 24, 2013
    If you’re like me, handicapping the Breeders’ Cup races is like judging the Miss Universe Pageant. Ultimately, all the contestants are above average in the looks department, they all want world peace and they all seem incredibly happy.

    In other words, as is the case with the Breeders' Cup events, there are few, if any, glaring toss-outs.

    Yet, unless one’s betting strategy entails wagering on every horse in every Breeders’ Cup race — which has produced a surprisingly decent -5.2 percent ROI since 1997, by the way — one must find a way to eliminate certain entrants... without any weeping and/or gnashing of teeth.

    Well, like Billy Swan, I can help.

    Using my database of BC results from 1997 to 2012, I found some angles that one can use to instantly eliminate horses from further consideration, thereby saving time and aspirin:

    1. Discard any horse that last raced on a dirt or all-weather surface if today’s race is on turf or that last raced over the lawn if today’s race is on the dirt.

    The Stats (since 1997): Six winners in 161 attempts, with a 0.44 impact value (IV) and a 0.56 odds-based impact value (OBIV).

    2. In routes (races of one mile or greater), toss any horse that last competed at six furlongs or less.

    The Stats: Two winners in 33 attempts (including Beholder last year), with a 0.68 IV and a 0.64 OBIV.

    3. Eliminate any horse with a median late speed ration (LSR) of -20 or less*.

    The Stats: Zero winners in 34 attempts.

    4. Reject any horse whose last-race form rating was less than 20 percent*.

    The Stats: Four winners in 119 attempts, 0.39 IV and a 0.59 OBIV.

    5. Toss any horse trained by Aidan O’Brien that is running on dirt.

    The Stats: This is no knock on O’Brien, whose overall BC record is impeccable (seven winners in 81 tries with a 1.01 IV). However, there is a clear distinction between the veteran conditioner’s starters on dirt (0.41 IV, 0.39 OBIV) and his starters on all-weather or turf (1.34 IV, 0.75 OBIV).

    6. In the juvenile turf events, don’t consider any horse with a Brisnet Turf Pedigree rating** of less than 110.

    The Stats: One winner (Maram, 2008 Juvenile Fillies Turf) in 59 tries, with a 0.22 IV and a 0.24 OBIV.

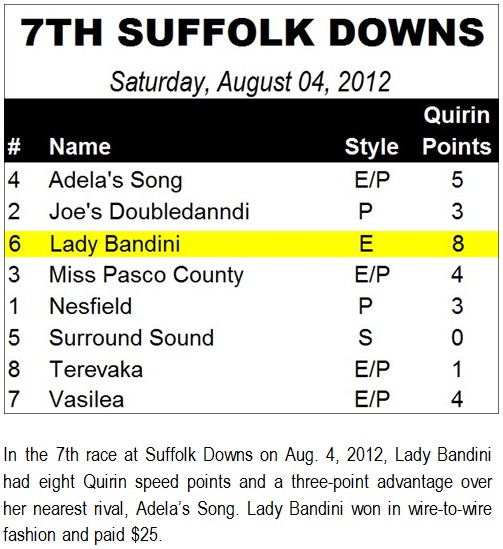
    7. In dirt races, avoid win bets on horses with an “S” style rating** (these types do finish in the money a fair amount of the time).

    The Stats: Seven winners in 138 attempts, 0.59 IV, 0.57 OBIV.

    Hopefully this will help you avoid a few losers and reduce your handicapping time on Breeders’ Cup Day.

    For more great stats like the ones above, be sure to check out my 2013 Breeders’ Cup Betting Guide available at Brisnet.com/bc and my 2013 Breeders’ Cup Trainers Guide available at SimonSpeedRations.com/products.


    * This number can be found in my Pace Profile Report available prior to the Breeders’ Cup via Brisnet.com or SimonSpeedRations.com.

    ** This rating can be found in the Brisnet past performances available at Brisnet.com.


  • Creating Your Own Systems & Angles

    POSTED Jul 31, 2013
    Recently, after telling a Facebook friend that my Win Factor and Pace Profile reports were best used in conjunction with one’s own handicapping or as the basis of a system or angle, I was asked a great question: “OK, so how do I come up with an angle?”

    Indeed. It is a question that has no easy answer. To me, developing a winning system — and the “winning” part should be stressed; anybody can develop a losing system — is part science, part art, part long nights and strong booze.

    Let me start by giving some advice on what not to do: Don’t try to string a bunch of positive impact-value factors together. Although this sounds like a great idea, in reality it doesn’t work.

    For example, according to my database studies, horses with the best last-race Brisnet speed figure have an impact value of 2.05 — meaning that they win approximately twice as often as expected (impact values are computed by dividing the percentage of winners showing a particular characteristic by the percentage of entrants possessing that characteristic). Those same studies also reveal that horses with the highest BRIS Power Rating have a 2.49 IV.

    Now, according to the more ardent impact-value handicappers, combining these factors should result in an IV in the neighborhood of 5.10 (2.05 x 2.49). Others are less optimistic, but still believe that the IV will be considerably higher than 2.49 (the higher IV of the two).

    The actual IV? 2.82.

    To put this in perspective, race favorites (excluding entries and/or multiple top betting choices) yield a 2.76 IV. Worse, none of these impact-value angles account for the odds, or ROI. And, as I stated at the outset, that is ultimately what we are concerned with. Horses with the best last-race speed figure yield a 17.1 percent loss; animals with the best BRIS Power Rating show a 14.9 percent loss; and the two factors combined produce a 15.9 percent loss.

    Of course, many impact-value handicappers have a solution to this value conundrum.

    “Just insist on higher odds,” they say, presumably with an indulgent smile.

    OK, let’s do that. Since horses with the highest last-race Brisnet speed figure and best BRIS Power Rating win approximately 38 percent of the time according to my studies, let’s insist on odds of 9-5, which, in theory, should result in a 5-6 percent ROI. (No point in being greedy and seeking higher odds.)

    Sadly, this “fair odds” requirement didn’t produce the money tree that we’d hoped for. In fact, it produced just the opposite. Not only did we lower the impact value of these combined factors to 1.76, but we also increased the negative ROI to -19.6 percent, worse than any of the individual factors.

    Naturally, this raises the question: Is there a way to stem all this red ink or am I simply trying to squash everybody’s dream of racetrack riches?

    The answer is no… no, I’m not trying to squash everybody’s dream of racetrack riches, that is. There are solutions to the issues I presented. While I don’t have the space to get very in-depth, here are some general guidelines to adhere to when developing your own systems and methods:

    1) Try to use unique criterion. One of the reasons that impact values don’t ascend like some handicappers expect them to when positive-IV factors are combined is because the factors overlap.

    For instance, I am reasonably sure that the BRIS Power Ratings take speed into account, so combining them with the best last-race speed figure as we did above is, in effect, double-weighting speed as a factor.

    That’s OK in some instances, but one should at least be aware of what they are doing.

    2) Related to the above, make sure that your rules make sense and that they work together. If you think last-race form is important — I certainly do — than you absolutely, positively need to impose a date requirement on that race. After all, is it really logical to credit a horse for a great last race (however one defines that) when it was run two years ago? I think not.

    3) Follow the KISS (keep-it-simple-stupid) principle whenever possible. Many a novice player goes astray by trying to make their angles/systems too complex. Unless you are using mathematical regression techniques or other advanced mathematical procedures to weight the factors you are using, stick with what you know.

    None of my angles take body language into account. Why? Because nine times out of 10 I can’t spot it, much less quantify it.

    4) This has been a key to my own success: Try to make your techniques as broad and universal as possible — don’t over-optimize.

    You will find that you can usually unearth profitable angles in any subset of data, but in doing so you run the very great risk of what some have called the “backtest fallacy.” In other words, as you pare down the data, you wind up fitting it to your preconceived notions, as opposed to the other way around.

    Hence, when you apply your “wonder system” to new data, it crumbles like Anthony Weiner’s political aspirations… again.
    I hope these rules help. I’ll end this piece with a sampling of my own angle/method spot plays for Wednesday, July 31:

    Performance Rating Angle Plays
    Bet to win at even odds (1-1) or greater

    BEU1: 2-Maestro Miss (2-1 on the morning line)
    DEL1: 5-Its Looking (7-2)
    DEL7: 7-Upside Down (3-1)
    NP2: 5-Kool Shazoom (8-5)
    NP4: 4-Passion Red (8-1)
    TDN2: 7-Sky Kerridge (3-1)

    Top Form Plays

    BEU2: 4-Swayze Lady (2-1)
    NP8: 5-Masked Man (15-1)
    PEN4: 1-Crimson Chrome (6-1)

    Top-LSR Plays

    BOI10: 3-Escaping the Storm (8-1)
    SAR4: 4-Rakin’ Gold (12-1)
  • Winning with Style

    POSTED Aug 9, 2012
    When Hansen went down in flames as the 3-5 favorite last weekend, many people — including a few “insiders” — were quick to point to the colt’s early duel with Hero On Order as the primary reason for his defeat.

    (Click on image to enlarge)
    Personally, I think that’s a load of malarkey — although Hansen was very headstrong (he often is), the fractions of the West Virginia Derby were far from taxing. Still, Hansen’s blue-tail beatdown does highlight why handicappers should carefully assess the pace scenario of the races they choose to play.

    In “Winning at the Races,” first published in 1979, author William Quirin attempted to help players do just that via his “speed point” method, which was designed to ferret out the likely frontrunners, pressers and closers in each race.

    Quirin assigned 0-8 points to every entrant eight points to confirmed early runners; zero points to horses that showed absolutely no early lick in their most recent outings. Bloodstock Research Information Services (BRIS) later adapted Quirin’s work and added a style designation to their Premium Plus and Ultimate past performances.

    Borrowed from Tom Brohamer and the Sartin Methodology, the “ESP running styles” are defined as follows:
    E (early) – Need-the-lead type that does its best running on the engine.
    E/P (early presser) – Horse that prefers running on the lead or 1-3 lengths behind the leader.
    P (presser) – Horse that races in the middle of the pack, 4-7 lengths behind the leader.
    S (sustainer) – An animal that generally stays well back early and makes one late, prolonged late run.
    After the West Virginia Derby, I began to wonder whether these great, but oft-overlooked, tools might be used to identify pace scenarios, as well as the horses most likely to benefit from them. Specifically, I wanted to isolate lone-speed races and races that figured to produce sizzling splits and/or a potential battle for the early lead.

    Toward that end, I began my research by looking strictly at horses that earned the maximum Quirin score (eight points). Here’s how they performed (using my database of over 2,000 races from tracks across the country):

    (Click on image to enlarge)

    Nothing real noteworthy. In both sprints (races under a mile) and routes (races of a mile or greater), the eight-point horses performed better than expected, although, somewhat surprisingly, many of the route types were overbet (witness the negative odds-based impact value, or OBIV).

    (Click on image to enlarge)

    With these baseline statistics in mind, I then examined horses that had a clear point advantage, i.e. lone-speed races:

    (Click on image to enlarge)
    * Does not include races with no other rated entrants.

    (Click on image to enlarge)
    Interestingly, these results — at least the results in sprints — somewhat mirror those obtained by Quirin 33 years ago, as we find that betting on eight-point speed horses in races featuring no other such animals actually produces a profit.

    Given these encouraging early returns, I was curious to see whether or not a contested pace might lead to the opposite phenomenon — more wins by closers (horses with an “S” ESP style rating).

    Of course, first, we need to find out how the “S” horses performed overall:

    (Click on image to enlarge)

    Clearly, these are not steeds one would want to bet on a regular basis, as the IV and OBIV — in both sprints and routes — attest to.

    But look at what happens when one looks solely at races featuring exactly two animals with 7-8 Quirin points apiece:

    (Click on image to enlarge)

    Not only do the numbers drastically improve, they turn positive in the win pool in sprints, and are also positive in the place and show pools in routes.

    I guess all those snooty fashion designers are right: style really does matter.
  • The Skinny on Overweights

    POSTED Aug 2, 2012
    When I used to go to the races as a kid, I followed the same pattern. I’d get a program to supplement my tattered and marked-up edition of the Daily Racing Form, find a comfortable table and chair in the gazebo and accept the offer of an ice-cold Pepsi from my stepdad, Dennis.

    Then, sipping on our overpriced and oversweetened beverages, swapping various sections of the Form like we were assembling a great puzzle (which, in a sense, we were), both Dennis and I would await track announcer Gary Henson to make his presence known.

    “Welcome to Longacres,” Henson would drawl in that distinctive, dulcet voice of his. “Here are today’s overweights and changes.”

    Like a dutiful servant, I would note the information in my program. Mostly I cared about the scratches, but I always wrote down the overweights as well.

    “In the sixth race, number two, Scamparina, is three pounds over… no changes in the seventh race… in the eighth race, number five, My Satire, has been withdrawn…”

    And so it would go until my program was filled with all the latest updates.

    At that point, smiling smugly at my efficiency and attention to detail, I would proceed to ignore all but the scratches and go about my day — not once, in 30+ years of playing the races, have I ever altered my selections or list of contenders based on a late change in weights.

    Recently, I’ve begun to wonder whether my dismissive attitude regarding this factor was/is wise, so I decided to find out.

    Using my new, handy-dandy results chart database program, I examined 889 races — I didn’t have the stamina for 890 — from various tracks across the country. My query was simple: Do horses that are carrying more than their assigned weight, i.e. overweights, win as often as they should?

    Now, before we go any further, let me explain the phrase “as often as they should.”  Simply put, this means that horses showing a specific characteristic — in this case, a greater race weight than assigned weight — win their rightful share of races.

    In his masterful work “Winning At The Races,” Dr. William Quirin introduced the concept of an “impact value,” which he calculated by “dividing the percentage of winners with a given characteristic by the percentage of starters with that characteristic.”

    “An IV of 1.00 means that horses with a specific characteristic have won no more and no less than their fair share of races,” Dr. Quirin explained.

    Similarly, an IV of greater than 1.00 denotes that a particular factor is producing more than its fair share of winners, while an IV under 1.00 means that it is producing less.

    In addition to Dr. Quirin’s original impact value, I will also offer an odds-based impact value when I present my findings later in this piece. The OBIV is based, not on field size, but on the average odds of the horses meeting the criteria of the study. The advantage of such an approach is that it better isolates the factor being tested by equalizing the winning chances of the horses that show it.

    For example, if one were to test what effect the letter “a” in a race favorite’s name had on its performance, it is abundantly clear to those who understand statistics that the impact value would be high… not because the horse’s name contained the letter “a,” mind you, but because the horse was favored.

    In fact, when I tested just such a proposition (race favorites with the letter “a” in their name) using my database, 579 horses qualified and the impact value was a staggering 2.78. Yet, the OBIV was only 0.81, which is right in line with expectations for race favorites as a whole (see graphic below).

    (Click on image to enlarge)

    So, with all of that out of the way, let’s get on to the fun stuff — the study itself.  The first thing I’ll post is how ALL of the horses in my survey of 889 races performed, just so we have some baseline statistics:

    Horses – 6,790
    Winners – 889
    Rate – 13.1%
    IV – 1.00
    OBIV – 0.81

    And now — drum roll, please — we’ll see what happens when a horse is asked to carry more than its assigned weight:

    Horses – 1,010
    Winners – 109
    Rate – 10.8%
    IV – 0.85
    OBIV – 0.73

    The results are stunning — at least to me — as they appear to confirm that additional, unassigned weight is, in fact, detrimental to a horse’s performance. Not only is the IV less than 1.00, but the OBIV is also below the 0.80 “fairness” threshold.

    I guess I should have paid more attention to Gary Henson.

    Weekend Handicapping Reports

    SATURDAY (8/4)